Yunwei Gai, Ph.D. Babson College
Nadia Nelipa, MBA. Associate Director of Marketing Analytics, Harte-Hanks, Inc
Frederick Afonso, MBA. Life Sciences Division, Simon-Kucher & Partners
Abstract
Health and medical care pervade every aspect of our lives. As the world population ages, an entirely new demographic stress will be put on healthcare systems. Some estimates project healthcare costs in the United States to account for 20% of GDP in the next few years. In comparison, China’s total expenditure on health as a percentage of GDP has risen steadily and it is currently below 6%. However, with the rise of life expectancy, an aging population and higher living standards, health expenditure in China will continue to rise. Another challenge China faces is healthcare system reform to ensure equity and to reduce health disparity. To solve these challenges, accurate collection of health statistics at the national level is needed.
In this article, we introduce and compare four national health databases in United States, which are pillars for evaluating national health profile and for formulating national health policies. The four databases are National Health Interview Survey (NHIS), Medical Expenditure Panel Survey (MEPS), National Health and Nutrition Examination Survey (NHANES) and Behavioral Risk Factor Surveillance System (BRFSS). As an example, we illustrate how to derive the prevalence of cholesterol screening from the four databases. Despite differences, the overall distributions follow similar patterns across four datasets. These databases can be linked with other data sources to answer more complicated questions in health and healthcare.
We hope that this article can draw the attention of Chinese health researchers and policymakers on the importance of health surveillance and can lead to more discussions and interest on how China can benefit from the U.S. experience in conducting health surveillance at the national level.
摘要: 医疗卫生关系着我们生活的方方面面.随着世界人口老龄化的趋势,医疗卫生系统正面临着新的压力. 在未来几年里,美国将花费其百分之二十的国民生产总值在医疗卫生方面.相比之下,虽然中国的医疗卫生开支在近几年持续增长,其份额在国民生产总值的百分之六以下, 但是随着人口寿命的增长,老龄化和生活水平的提高,医疗卫生开支将会继续上升.除此之外, 如何通过医疗体系改革去保证医疗公平,解决城乡差别是中国面临的另一大挑战. 要解决这些问题,准确的全国范围内的医疗卫生数据是一个必须条件.
在此文中, 我们简单介绍美国四个主要的全国范围的医疗卫生数据库: National Health Interview Survey (NHIS), Medical Expenditure Panel Survey (MEPS), National Health and Nutrition Examination Survey (NHANES) and Behavioral Risk Factor Surveillance System (BRFSS). 这四个数据库是衡量美国健康卫生状况及制定医疗卫生政策的主要依据. 以全国范围内胆固醇检测率为例, 虽然结果有所不同, 但总的趋势在四个医疗卫生数据库中是相近的. 这四个数据库可以与其他数据库连接以探讨更复杂的健康卫生问题.
我们希望本文能引起中国健康卫生研究人员及政策制订者对全国范围内的医疗卫生数据库的重视. 通过参考美国在健康卫生数据方面的经验及教训, 对中国制订出一套符合其国情的,有效的,准确的卫生数据收集整理系统可以有所帮助.
Introduction
Health and medical care pervade every aspect of our lives. As the world population ages, an entirely new demographic stress will be put on healthcare systems. Some estimates project healthcare costs in U.S. to account for 20% of GDP in the next few years (Cutler, 2010). In comparison, China’s total expenditure on health as a percentage of GDP has risen steadily and it is currently below 6% (World Health Organization, 2011). However, with the rise in life expectancy, an aging population and higher living standards, China’s health expenditure will continue to rise. Another challenge China faces is health system reform to ensure equity and to reduce and eliminate disparity. To address these challenges, accurate collection of health statistics at the national level is needed. In this article, we introduce four national health databases in United States, which are the pillar for evaluating national health profile and for creating national health policies. We hope that this article can lead to more discussions and interest on how China can benefit from the U.S. experience in conducting health surveillance at the national and sub-national level.
In the United States, the National Health Interview Survey (NHIS), the Medical Expenditure Panel Survey (MEPS), the National Nutrition Examination Survey (NHANES), and the Behavioral Risk Factor Surveillance System (BRFSS) are the four most cited sources of information in various studies examining healthcare behavior and outcomes at the national level. They are widely used by both healthcare researchers and policy makers. For example, The Affordable Care Act (United States, 2010), signed into Law by President Barrack Obama in March of 2010, put in place health insurance reforms that were meant to enhance the quality and accessibility of healthcare to the American population. Implementation of the law will be phased in through 2014, and one of the provisions provides patients with access to recommended preventive services at no cost. Health plans effective on or after September 23, 2010 must cover certain preventive services without charging patients out-of-pocket costs (i.e. co-pays, coinsurance, and deductibles). On July 14, 2010, Departments of Health and Human Services, the Treasury, and Labor issued new regulations specifying which preventive services will be covered under new health plans. Regulations follow recommendations from the U.S. Preventive Services Task Force (USPSTF), an independent panel, and cover services such as diabetes screening, certain immunizations, and certain cancer screenings.
Throughout the entire process, the four databases are pillars for predicting costs, measuring utilization levels, and evaluating cost-effectiveness of interventions. The USPSTF used 2002 NHANES data, which indicated that 9.3% of the total US population 20 years of age or older had diabetes with an estimated total cost of the condition at $132 billion ($92 billion in direct medical and $40 billion in indirect costs) (Norris et al., 2008). A recently published article in the American Journal of Public Health (Ormond et al., 2011) estimated that a 5% reduction in diabetes and hypertension prevalence could lead to annual savings of approximately $9 billion. The savings were based on simulated counterfactual morbidity and medical care expenditures from the 2003 to 2005 MEPS Household Component data. Based on the distributions of age, gender, weight, blood pressure, cholesterol and an array of chronic conditions derived from 1999 to 2004 NHANES data, and the annual cost per disease estimated from multivariate regression analysis using 2000 to 2004 MEPS, Dall et al. (2009) simulated that modest to aggressive changes in diet can lead to a $60 to $120 billion reduction in annual health expenditures. The model in Dall et al. study measured potential health benefits and savings from intake reductions in calories, sodium, and saturated fats. Utilizing PubMed’s search engine, we estimated that from 2000 to 2009 there have been over 400 published articles that used NHIS, 300 for MEPS, 1600 for NHANES, and 500 for BRFSS. Data from each of the four major national health databases often underpins major studies, which then are adopted for creating national health policies. For example, the Congressional Budget Office frequently used the information from NHIS and MEPS to estimate the health care expenditures, insurance coverage, potential impacts of health initiatives, and source of payments at the national level, based on which important policy considerations were derived (e.g., United Sates, 2003, 2007, and 2010).
The Four National Healthcare Databases in the United States
The following is a brief introduction of the four databases and their history.
NHIS: www.cdc.gov/nchs/nhis.htm
The National Health Interview Survey (NHIS) has been conducted since 1957, and monitors the health of the civilian non-institutionalized population in the United States. Data is collected by the National Center for Health Statistics (NCHS), which is part of the Centers for Disease control and Prevention (CDC). NHIS gathered information on demographics, socioeconomics, and on a broad range of health topics. The NHIS data is collected continuously throughout the year, and is a household cross-sectional interview survey. A two-part questionnaire was used from 1982-1996, which collected information on basic health and demographics and current health topics. In 1997 the questionnaire was revised into core questions and supplements in order to improve data collection regarding insurance, access, and health behavior information.
The survey consists of two stages: stage one collects a sample of 428 primary sampling units (PSUs), which can be a county, or group of counties, or a metropolitan area, and stage two assigns permit and area segments to each PSU. Sample design oversamples Black, Hispanic, and Asian persons through screening and oversampling area segments. Expected sample size is approximately 35,000 households with 87,500 individuals. Survey results have been used to track national health status (e.g. Pleis et al., 2008), health care access (e.g. Ye et al., 2011) and the trend of national health objectives (e.g. Mojtabai, 2011).
NHIS has been linked with several national databases including National Death Index (NDI), CMS Medicare data, Social Security Benefit History Data, and Medical Expenditure Panel Survey. The linked databases have been used to examine various health and healthcare questions that cannot be answered by each database alone. For example, Druss et al (2011) used the linked NHIS and the NDI data to analyze the premature death of persons with mental illness at the national level. The authors found that although metal illness is a significant risk factor for premature mortality, socioeconomic, healthcare, and other clinical risk factors also play an important role.
MEPS: www.meps.ahrq.gov/
The Medical Expenditure Panel Survey (MEPS) has been conducted since 1996, and monitors health services utilization, costs, payment methods, and health insurance related data across the U.S. The survey is broken up into a household sample component which collects data from families and individuals that participated in NHIS survey in the prior year, and an insurance component that collects on public and private employee health insurance plans. There is also a Medical Provider Component which supplements information collected from the household component. Each individual in MEPS is surveyed five times over two and a half years. The predecessors to MEPS are the National Medical Care Expenditure Surveys (NMCES) conducted in 1977 and the National Medical Expenditure Survey (NMES) conducted in 1987.[1]
Due to the extensive interview process, MEPS has a smaller panel than NHIS with approximately 15 thousand responders yearly. The survey is valuable in that it provides an in-depth view into the population’s use and detailed expenses of health services. It is among the very few surveys that contain individual level medical expenditure/charge data besides the Medicare Current Beneficiary Survey and State Inpatient Databases.
MEPS have been linked with NHIS permitting longitudinal analyses over a 3-year period.[2] The confidential non-public use versions of MEPS contain State, County FIPS Codes, Census Tract and Block-Group Codes, which can be merged with other databases by these geographic linkages. For example, Gaskin et al. (2011) merged the 2006 MEPS with 2000 U.S. Census Summary File 1 by zip codes to analyze whether race/ethnic disparities in health care use were associated with residential segregation.
NHANES: www.cdc.gov/nchs/nhanes.htm
The National Health and Nutrition Examination Survey (NHANES) has been conducted since the early 1960s, and monitors health and nutritional data of U.S. children and adults. The survey collects information from a nationally representative sample of approximately 5,000 individuals annually through interviews and physical examinations of individuals. The interview portion takes place in respondents’ homes and collects demographic, socioeconomic, dietary, and health-related information. The physical examination takes place in mobile medical centers and collects clinical measurements, nutritional and biometric variables, and laboratory test results, which is an advantage of NHANES in comparison to survey-based self-reported responses in NHIS, MEPS, BRFSS and many other health databases. For example, Stommel et al. (2009) found deviations of the self-reported Body Mass Index (BMI) values from clinically measured BMI values, particularly at the high and low ends of the BMI scale, which are large enough to result in substantial misclassifications of either underweight or obese people.
BRFSS: www.cdc.gov/brfss/
The Behavioral Risk Factor Surveillance System (BRFSS) has been conducted since 1984, and monitors health risk, preventive, and access related to chronic disease and injury across U.S. states. Data is collected monthly via telephone interview with coordination from the CDC. Standard core questions enable results comparison across states and on a national basis. The CDC also provides resources to states to customize surveys and also provides technical analysis and survey methodology assistance. The survey collects information from more than 400,000 adults across 50 states, the District of Columbia, U.S. Virgin Islands, and Guam.
Different from the other three surveys, BRFSS is state-based and collects information on respondent’s county of residence and metropolitan area. It is thus more appropriate for evaluating state-specific health and healthcare status. State health agencies frequently use BRFSS results for targeting resources to reduce behavioral risks and tracking trends of health outcomes. CDC’s Selected Metropolitan/Micropolitan Area Risk Trends (SMART) project is one of the many applications using BRFSS to identify emerging health problems, establish and track health objectives, and develop and evaluate public health policies and programs at county, city, metropolitan and micropolitan levels. In addition, BRFSS has been linked with other data by geographic variables for more complex health and social problems. It has been linked with the Area Resource File at the county level to explore the relationships between race/ethnicity and area factors affecting access to health care in the United States (Coughlin et al., 2008); with state unemployment rate to examine the effect of business cycles on eating habits (Dave and Kelly, 2011). This unique feature of BRFSS may be appropriate to be adopted by local governments in China to collect and analyze data for public health policy-making.
A Comparison of the Four Databases
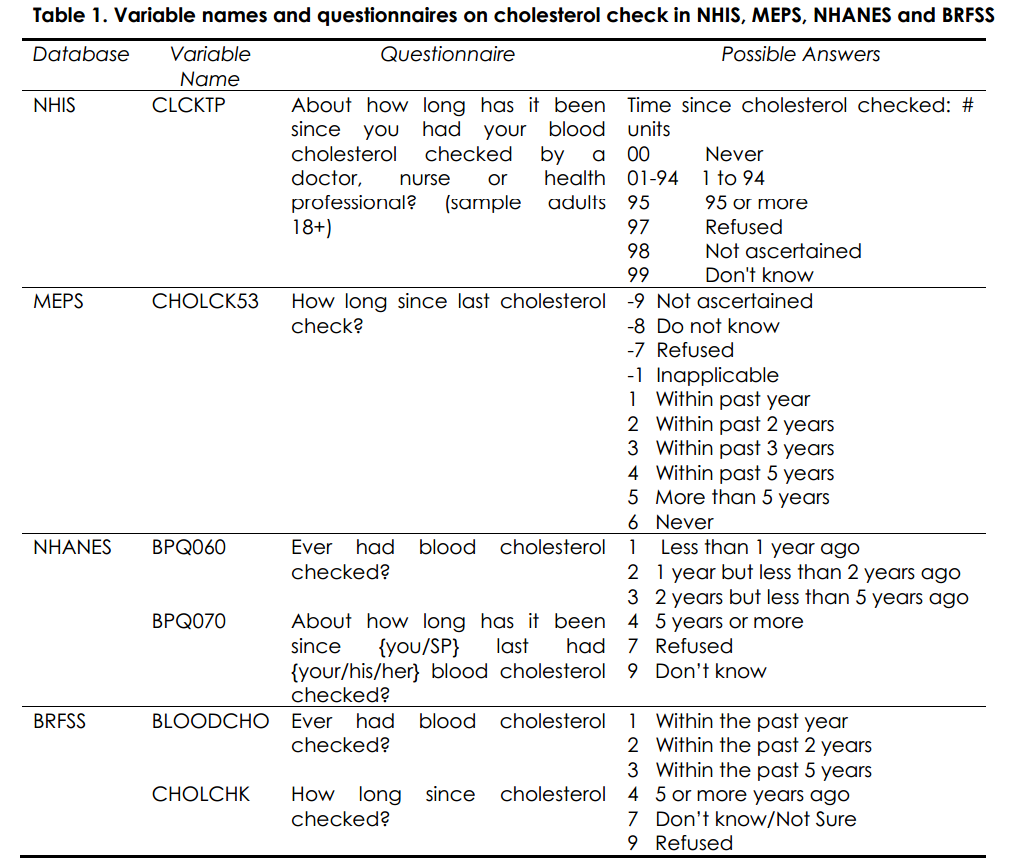
One advantage of having multiple national health databases is the possibility to validate the results, which can be used as an accuracy evaluation (Fahimi et al., 2008; Macek et al., 2002; Johnson et al., 2010; Carlson et al., 2009). Although the questionnaire and focus of each database is different across surveys, the data collection methodology is similarly based on multi-stage sampling. Each database provides sampling weights to derive healthcare statistics at the national level. In this section, we compare the utilization rate of blood cholesterol checkup across the four databases in 2008. There is a common question in all four databases on whether and when blood cholesterol checkup was performed. Table 1 is a comparison of the variables names, questionnaires and possible answers in each database.
We focus next on the adult population age 18 and above. For each database, we calculate the weighted percentage utilization within the past year, within the past two years, within past five years, and more than five years. The results are listed in Table 2.
Due to differences in sample sizes, questionnaire design, and contact methods, the blood cholesterol checkup rates are different across the four databases. The largest difference is between NHANES and NHIS on the percentage of cholesterol checkup within the past year. Despite these discrepancies, the overall distributions follow similar patterns across four datasets.
Another advantage of having multiple healthcare databases is the possibility to link one to the other to answer more complicated questions in healthcare. For example, Short, et al. (2011) linked MEPS with NHIS to provide national estimates of medical expenditures for all adult cancer survivors aged <65 years. Hanmer, et al. (2006) merged MEPS and NHIS to create nationally representative values for 7 of the most common health-related quality-of-life (HRQoL) scores, stratified by age and sex.

Discussion
In this article, we briefly introduced four major national health databases in the United States. Although they all collect respondents’ demographic, socioeconomic and health related information, each one has its unique features which can be used to analyze different health issues. NHIS is mainly designed to track access to healthcare (e.g. health insurance, immunization, and access to medical care) and health status (e.g. obesity, diabetes, HIV and asthma) at the national level. NHANES and MEPS can be used to complement NHIS. Instead of self reports in NHIS, NHANES collects clinical information based on a wide range of physical examinations and laboratory tests. For a complete list of these examinations and tests please refer to their websites.[3] This important aspect of NHANES allows researcher to conduct interdisciplinary research that combines social science with medical science. MEPS excels in detailed health expenditure statistics including individual’s expenditure for each medical event and medical condition (e.g. in-patient care, out-patient care, treatment for chronic conditions and different types of cancer, and prescription drugs) and the amount from each payment source (e.g. out-of-pocket payments and payments by private insurance, Medicaid, Medicare, and other sources). Researchers and policy makers use MEPS to analyze and project health expenditures and health insurance related topics. NHIS, NHANES and MEPS focus mainly on the national level. While it is important to track national level information, achieving better health in a country requires co-ordinations and better resource allocations at the local government level. One of the main purposes of BRFSS is to provide health information and risk factors at the state, county, and metropolitan levels for designing local health policies. In addition, researchers can link each of the databases with other data sources to investigate more complicated healthcare questions as discussed in earlier sessions.
To test the reliability, we compared the utilization rates of cholesterol checkup across the four datasets. Because each database has different purposes, questions, contact methods and sample selections may be different. This explains why for the same preventive service, cholesterol checkup, we find somewhat different utilization rates at the national level. Despite these differences, we find that the overall patterns are similar. If needed, researchers and policy makers can combine the results and get estimates of the upper and lower bounds.
U.S. has a long history in tracking national health statistics. Reliable sampling techniques have been developed, implemented and tested over decades. In comparison, China’s health and healthcare data collection is at its nascent stage. To the best of the authors’ knowledge, the following two databases are frequently used for studying China’s health and healthcare: the China Health and Nutrition Survey (CHNS) and the China Public Health Statistical Yearbook. CHNS is an international collaborative project between the Carolina Population Center at the University of North Carolina and the National Institute of Nutrition and Food Safety at the Chinese Center for Disease Control and Prevention. The survey, first conducted in 1989, covers nine provinces and is composed of four parts including the household survey, individual survey, nutrition and physical examination, and community survey. The publicly available data can be downloaded online.[4] The CHNS website and Liu (2008) provide a detailed discussion on the survey design, methods and variables. CHNS has been widely used by researchers from China, U.S. and other countries to study the impact of various socioeconomic factors (e.g. family planning policies, local and national public health programs, infrastructures and income distribution) on nutrition, health behavior, and health outcomes. At a first glance, CHNS shares many features of NHIS, NHANES, MEPS and BRFSS. It collects overall health status, dietary and physical examination, income and health insurance information, and behavior and risk factors. However, the content of CHNS survey is rather limited in comparison to the four U.S. national health databases. CHNS only collects data from nine provinces mainly located in the eastern part of China. Heavily populated provinces including Jilin, Hebei, Shanxi, Shaanxi, Sichuan, Zhejiang, Anhui, Fujian and Guangdong are not in the survey, which limits the use of the data for designing local and national health policies.
China Public Health Statistical Yearbook is compiled by China’s Ministry of Health.[5] It covers the whole nation including the 31 provinces, autonomous regions and municipalities. The yearbook contains rich information on health institutions and facilities, healthcare personnel, public health expenditure and programs, and health status by different age, gender and location groups. However, these data are mainly at the aggregate level and not accessible to the public. In addition to the two main databases, regional surveys have been conducted in an ad hoc fashion to address local healthcare problems such as the data on methadone maintenance treatment (MMT) patients in Kunming and Shanghai (Hser et al., 2011), a health survey conducted in seven of Mainland China’s largest cities in 2002 (Sun et al., 2011), and a health survey of 15 counties in 2003 (Wagstaff et al., 2009). Because of its ad hoc and regional nature, it is difficult to track health and healthcare trends at the national level and at local levels consistently.
It is our belief that China can benefit from the history and experience of the United States and other developed countries in establishing its own national healthcare databases. Lessons and practices from other countries can help China establish its own health surveillance system that fits better the need and challenges of its 1.3 billion citizens.
References:
Carlson, S. A., Densmore, D., Fulton J.E., Yore M.M., and H.W. Kohl, 3rd (2009). “Differences in Physical Activity Prevalence and Trends from 3 U.S. Surveillance Systems: NHIS, NHANES, and BRFSS.” Journal of Physical Activity and Health 6 (Supplement) 1: S18–27.
Coughlin, S.S., Leadbetter, S., Richards, T., and S.A. Sabatino (2008). “Contextual analysis of breast and cervical cancer screening and factors associated with health care access among United States women.” Social Science & Medicine 66: 260–275.
Cutler, D (2010). “How Health Care Reform Must Bend the Cost Curve.” Health Affairs 29(6): 1131–35.
Dall, T.M., Fulgoni, V.L. 3rd., Zhang, Y., Reimers, K.L., Packard, P.T., and J. D. Astwood (2009). “Potential Health Benefits and Medical Cost Savings from Calorie, Sodium, and Saturated Fat Reductions in the American Diet.” American Journal of Health Promotion 23(6): 412–422.
Dave, D.M. and I.R. Kelly IR (2011). “How does the business cycle affect eating habits?” Social Science & Medicine (Epub ahead of print).
Druss, B.G., Zhao, L., Von Esenwein, S., Morrato, E.H., and S.C. Marcus (2011). “Understanding Excess Mortality in Persons With Mental Illness: 17-Year Follow Up of a Nationally Representative US Survey.” Medical Care 49(6): 599–604.
Fahimi, M., Link, M., Mokdad, A., Schwartz, D.A., and P. Levy (2008). “Tracking Chronic Disease and Risk Behavior Prevalence as Survey Participation Declines: Statistics from the Behavioral Risk Factor Surveillance System and Other National Surveys.” Preventing Chronic Disease 5(3): A80.
Gaskin, D.J., Dinwiddie, G.Y., Chan, K.S., and R. McCleary (2011). “Residential Segregation and Disparities in Health Care Services Utilization.” Medical Care Research and Review (Epub ahead of print).
Hanmer, J., Lawrence, W.F., Anderson, J.P., Kaplan, R.M., and G.F. Dennis (2006). “Report of Nationally Representative Values for the Noninstitutionalized US Adult Population for 7 Health-Related Quality-of-Life Scores.” Medical Decision Making 26(4): 391–400.
Hser, Y., Du, J., Li, J., Zhao, M., Chang, Y.J., and C.Y. Peng (2011). “Hepatitis C among methadone maintenance treatment patients in Shanghai and Kunming, China.” Journal of Public Health (Epub ahead of print).
Johnson P.O., Lynn, A.B., Call, K.T., and D. Michael (2010). “American Indian/Alaska Native Uninsurance Disparities: A Comparison of 3 Surveys.” American Journal of Public Health 100(10): 1972–79.
Liu, H (2008). “The China health and nutrition survey: an important database for poverty and inequality research.” Journal of Economic Inequality 6: 373–376.
Macek, M. D., Manski, R.J., Vargas, C.M., and J.F. Moeller (2002). “Comparing Oral Health Care Utilization Estimates in the United States across Three Nationally Representative Surveys.” Health Services Research 37(2): 499–521.
Mojtabai, R (2011). “National Trends in Mental Health Disability, 1997–2009.” American Journal of Public Health 101(11): 2156–2163.
Norris, S.L., Kansagara, D., Bougatsos, C., and P. Nygren (2008). “Screening for Type 2 Diabetes: Update of 2003 Systematic Evidence Review for the U.S. Preventive Services Task Force.” Evidence Synthesis No. 61. AHRQ Publication No. 08-05116-EF-1. Rockville, Maryland: Agency for Healthcare Research and Quality.
Ormond, B.A., Spillman, B.C., Waidmann, T.A., Caswell, K.J., and B. Tereshchenko (2011). “Potential National and State Medical Care Savings from Primary Disease Prevention.” American Journal of Public Health 101(1): 157–64.
Pleis, J.R., Lucas, J.W., and B.W. Ward (2008). “Summary health statistics for U.S. adults: National Health Interview Survey, 2008.” Vital Health Statics 10(242): 1-157.
Short, P.F., John R.M., and P. Rajeshwari (2011). “Medical Expenditures of Adult Cancer Survivors Aged <65 Years in the United States.” Cancer 117(12): 2791-800.
Stommel, M., and C. Schoenborn (2009). “Accuracy and usefulness of BMI measures based on self-reported weight and height: findings from the NHANES & NHIS 2001-2006.” BMC Public Health 9(1): 421–431.
Sun, P., Unger, J.B., Palmer, P., Ma, H., Xie, B., Sussman, S., and C.A. Johnson (2011). “Relative income inequality and selected health outcomes in urban Chinese youth.” Social Science & Medicine (Epub ahead of print).
United States (2003). “How Many People Lack Health Insurance and For How Long?” Washington, D.C.: Congress of the United States, Congressional Budget Office. http://www.cbo.gov/ftpdocs/42xx/doc4210/05-12-Uninsured.pdf accessed on December 10, 2011.
United States (2007). “CBO's health insurance simulation model: A technical description.” Washington, D.C.: Congress of the U.S., Congressional Budget Office. http://www.cbo.gov/ftpdocs/87xx/doc8712/10-31-HealthInsurModel.pdf. Accessed on December 10, 2011.
United States (2010). “An Act Entitled the Patient Protection and Affordable Care Act.” Washington, D.C.: the United States Government Printing Office http://www.healthcare.gov/law/introduction/index.html; accessed on October 28, 2011.
United States (2010). “CBO's Cost Estimate for James Zadroga 9/11 Health and Compensation Act of 2010.” Washington, D.C.: Congress of the U.S., Congressional Budget Office. http://www.cbo.gov/ftpdocs/115xx/doc11592/hr847.pdf accessed on December 10, 2011.
World Health Organization (2011). “World Health Statistics 2011.” Geneva, Switzerland: World Health Organization.
Wagstaff, A., Lindelow, M., Jun, G., Ling, X., and Q. Juncheng (2009). “Extending health insurance to the rural population: An impact evaluation of China's new cooperative medical scheme.” Journal of Health Economics 28(1):1–19.
Ye, J., Mack, D., Fry-Johnson, Y., and K. Parker (2011). “Health Care Access and Utilization Among US-Born and Foreign-Born Asian Americans.” Journal of Immigrant and Minority Health (Epub ahead of print).

Yunwei Gai, Ph.D.
Assistant Professor
Economics Division
Babson College
231 Forest Street
Babson Park, MA 02457-0310
Tel: 781-239-5052
Fax: 781-239-5239
Email: ygai@babson.edu